Multiple Choice
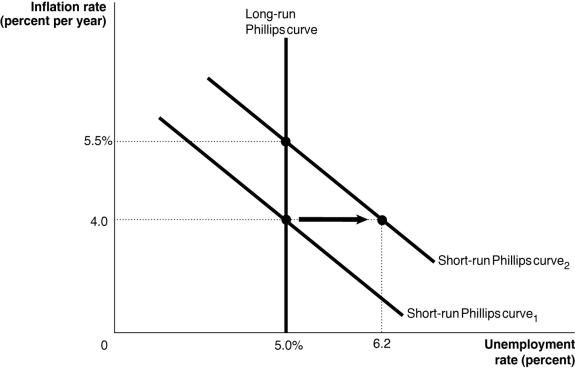
Figure 17-4 
-Refer to Figure 17-4.Consider the shift in the short-run Phillips curves shown in the above graph.This shift may be explained by
A) an increase in the natural rate of unemployment from 5.0 to 6.2 percent.
B) an increase in the expected rate of inflation from 4.0 to 5.5 percent.
C) either an increase in the natural rate of unemployment from 5.0 to 6.2 percent or an increase in the expected rate of inflation from 4.0 to 5.5 percent.
D) None of the above is correct.
Correct Answer:

Verified
Correct Answer:
Verified
Q1: Matt's real wage in 2018 is $26.80.If
Q2: A higher inflation rate can lead to
Q3: In the dynamic AD-AS model,when will a
Q5: If the Federal Reserve attempts to continue
Q6: All of the following have enhanced the
Q7: Which of the following best describes the
Q8: The key to understanding the short-run trade-off
Q9: If expected inflation falls,the long-run Phillips curve
Q10: Figure 17-2 <img src="https://d2lvgg3v3hfg70.cloudfront.net/TB1236/.jpg" alt="Figure 17-2
Q11: In the dynamic AD-AS model,when will an