Multiple Choice
Figure 19-1 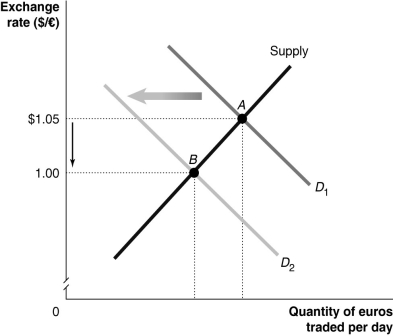
-Refer to Figure 19-1.Which of the following would cause the change depicted in the figure above?
A) U.S.productivity falls relative to European productivity.
B) Americans increase their preferences for goods produced in the EU relative to American goods.
C) The United States imposes a quota on wine from the European Union.
D) The price level of goods produced in the EU decreases relative to the price level of goods produced in the United States.
Correct Answer:

Verified
Correct Answer:
Verified
Q9: China's exchange rate system from 1994 through
Q10: Figure 19-4 <img src="https://d2lvgg3v3hfg70.cloudfront.net/TB1236/.jpg" alt="Figure 19-4
Q11: From the nineteenth century until the 1930s,the
Q12: The Danish currency,the krone,is pegged to the
Q13: Limits on the flow of foreign exchange
Q15: In a fixed exchange rate system,speculation regarding
Q16: Actions taken by investors who sell a
Q17: The currencies of Poland and Iceland (the
Q18: Under the Bretton Woods exchange rate system,the
Q19: A currency pegged at a value above