Multiple Choice
Figure 19-11 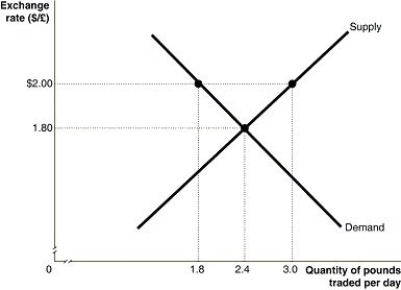
-Refer to Figure 19-11.The graph above depicts supply and demand for British pounds during a trading day,where the quantity is millions of pounds.In order to support a fixed exchange rate of $2.00 per pound,the British central bank must
A) buy 0.6 million pounds per trading day.
B) sell 0.6 million pounds per trading day.
C) buy 1.2 million pounds per trading day.
D) sell 1.2 million pounds per trading day.
Correct Answer:

Verified
Correct Answer:
Verified
Q44: Will the use of the euro help
Q45: Which aspects of globalization help to increase
Q46: Although the pegged exchange rate between the
Q47: Should European nations which are not currently
Q48: If one U.S.dollar could be exchanged for
Q50: Briefly describe how the Bretton Woods system
Q51: Figure 19-7 <img src="https://d2lvgg3v3hfg70.cloudfront.net/TB1236/.jpg" alt="Figure 19-7
Q52: The _ in the United States is
Q53: How will the exchange rate (foreign currency
Q54: Foreign portfolio investment in the United States