Multiple Choice
An experiment was done to determine the decimal reduction time of a specific population of organisms at 80oC.The data is indicated by an arrow on the graph.Which labeled line represents the likely results if the experiment was repeated using a lower temperature?
A) Line A
B) Line B
C) Line C
D) Line D 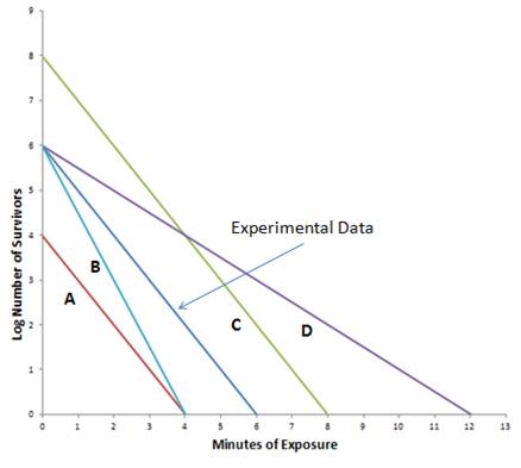
Correct Answer:

Verified
Correct Answer:
Verified
Q57: Bacteriophage therapy was developed after antibiotics were
Q58: Which kind of sterilization procedure takes advantage
Q59: The first product to be commercially treated
Q60: A(n)_ is a chemical that can be
Q61: Which of the following is a function
Q63: Because filtration removes rather than destroys microorganisms,it
Q64: Which of the following would be most
Q65: Which of these is an agent that
Q66: Disinfectants are generally regulated by the<br>A)Food and
Q67: Joseph Lister<br>A)pioneered the use of gamma rays