Multiple Choice
An experiment was done to determine the decimal reduction time of a specific population of organisms at 80oC.The data is indicated by an arrow on the graph.Which labeled line represents the likely results if the experiment was repeated at the same temperature,but starting with a larger number of organisms?
A) Line A
B) Line B
C) Line C
D) Line D 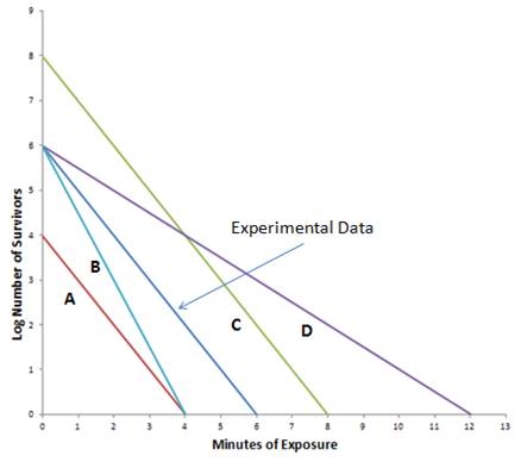
Correct Answer:

Verified
Correct Answer:
Verified
Q21: Which of the following is MOST effective
Q22: Larger populations generally are killed as rapidly
Q23: Pasteurization is used to<br>A)kill any pathogens present.<br>B)retard
Q24: Sterilization involves _ all viable microorganisms.<br>A)killing<br>B)removing<br>C)killing OR
Q25: Heavy metals are effective antimicrobial agents but
Q27: Amphipathic organic molecules that serve as disinfectants
Q28: Fecal transplants have been successfully used to
Q29: The disinfectant action of phenol and phenolic
Q30: An agent that prevents the growth of
Q31: Moist heat sterilizes by<br>A)causing the formation of