Multiple Choice
This graph shows three different budget constraints: A,B,andC.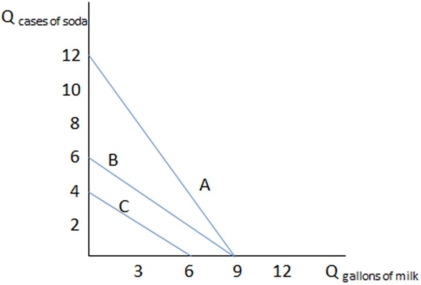
If Larry has budget constraint B in the graph shown,what is his opportunity cost of one gallon of milk?
A) It is the amount of soda he can't buy if he uses the money to buy a gallon of milk.
B) It is the amount of soda he could buy with the dollars it takes to buy one gallon of milk.
C) It is less than one case of soda.
D) All of these are true.
Correct Answer:

Verified
Correct Answer:
Verified
Q1: The concept of marginal utility:<br>A)explains why individuals
Q3: When economists observe someone make a choice,they
Q4: Utility is:<br>A)difficult to measure because it is
Q7: When the price of one good changes,and
Q9: Zachary plays the piano for a half
Q10: If Bella eats one piece of pie,she
Q34: Ben is asked to rate the utility
Q66: Ethan enjoys buying books and going to
Q99: When a person's income decreases,the slope of
Q123: Reciprocity means:<br>A) responding to another's actions with