Multiple Choice
The graph below shows the levels of estrogen and progesterone over the course of the menstrual cycle.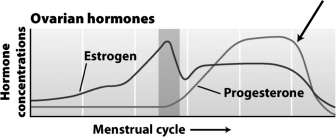
What event is caused by the rapid decrease in hormones in the region indicated by the arrow in the upper right portion of the graph?
A) ovulation
B) menstruation
C) formation of the corpus luteum
D) follicle maturation
Correct Answer:

Verified
Correct Answer:
Verified
Q1: Human growth hormone can decrease body fat
Q2: The high levels of progesterone seen after
Q4: After ovulation,<br>A) gonadotropin levels rise quickly.<br>B) estrogen
Q5: Acromegaly results from<br>A) too little gonadotropin.<br>B) a
Q6: Adrenalin and norepinephrine<br>A) have an effect similar
Q7: In humans,sex hormones only begin to work
Q8: Which of the following choices best explains
Q9: When blood glucose levels drop to a
Q10: Four to six weeks after conception,sex hormones
Q11: A(n)_ is a specialized organ in which