Short Answer
The graph below depicts the change in antibody concentration following an initial and a later pathogen exposure.
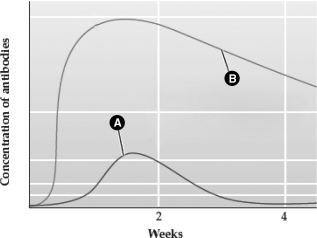
The line labeled with the letter ________ represents the response after the initial exposure.
Correct Answer:

Verified
Correct Answer:
Verified
Related Questions
Q10: An autoimmune disease could occur if<br>A) B
Q11: Folklore has produced this advice: "Starve a
Q12: The diagnosis of cancer represents a failure
Q13: HIV attacks B lymphocytes;this lowers the effectiveness
Q14: During a major infection a fever often
Q16: Vaccinations are required prior to traveling to
Q17: On occasion the immune response in inappropriate;for
Q18: Helper T cells perform all of the
Q19: After the initial exposure to a pathogen,subsequent
Q20: Cytotoxic T cells<br>A) directly kill viruses.<br>B) kill