Multiple Choice
The graph below shows the normal concentration of morphogens A and B throughout a Drosophila embryo.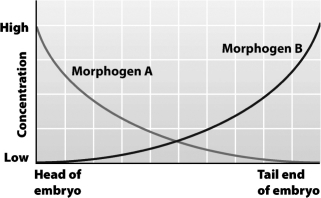
If morphogen B is injected into the head end of an embryo,the embryo is likely to develop
A) normally.
B) a second tail at the head end.
C) a second head at the tail end.
D) two heads at the head end.
Correct Answer:

Verified
Correct Answer:
Verified
Q53: In oogenesis,the final steps of meiosis do
Q54: An aquatic animal that relies on currents
Q55: Examine this close-up of the placenta (on
Q56: The genetic material in an egg cell
Q57: In humans,the exchanges of materials between the
Q59: Hyperemesis gravidarum,severe morning sickness,is caused by a
Q60: In general,why does a female animal tend
Q61: Why does an embryo undergo the process
Q62: During the rapid cell division that occurs
Q63: Fertilization of an egg with more than