Multiple Choice
The figure shows a graph of the position x of two cars,C and D,as a function of time t. 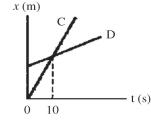
According to this graph,which statements about these cars must be true? (There could be more than one correct choice. )
A) The magnitude of the acceleration of car C is greater than the magnitude of the acceleration of car D.
B) The magnitude of the acceleration of car C is less than the magnitude of the acceleration of car D.
C) At time t = 10 s,both cars have the same velocity.
D) Both cars have the same acceleration.
E) The cars meet at time t = 10 s.
Correct Answer:

Verified
Correct Answer:
Verified
Q101: Which of the following quantities has units
Q102: A bullet shot straight up returns to
Q103: Two objects are dropped from a bridge,an
Q104: A car is traveling with a constant
Q107: Acceleration is sometimes expressed in multiples of
Q108: When is the average velocity of an
Q109: An object is thrown upwards with a
Q110: Two identical objects A and B fall
Q111: Abby throws a ball straight up and
Q512: If the position versus time graph of