Multiple Choice
The graph in the figure shows the x component F of the net force that acts for 10 s on a 100-kg crate.What is the change in the momentum of the crate during the 10 s that this force acts? 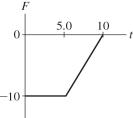
A) -100 kg ∙ m/s
B) -25 kg ∙ m/s
C) 75 kg ∙ m/s
D) -75 kg ∙ m/s
E) 25 kg ∙ m/s
Correct Answer:

Verified
Correct Answer:
Verified
Related Questions
Q69: A fire hose is turned on the
Q70: A firecracker breaks up into two pieces,one
Q71: A 1200-kg ore cart is rolling at
Q72: In the figure,determine the character of the
Q73: A 320-g air track cart traveling at
Q75: A 50-g ball moving at 10 m/s
Q76: Two simple pendulums of equal length l
Q77: Two friends are standing on opposite ends
Q78: A 1500-kg car traveling at 90 km/h
Q79: A 0.330-kg volleyball is thrown vertically downward