Multiple Choice
The figure shows a graph of the position x as a function of time t for a system undergoing simple harmonic motion.Which one of the following graphs represents the velocity of this system as a function of time? 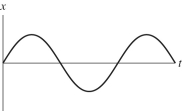
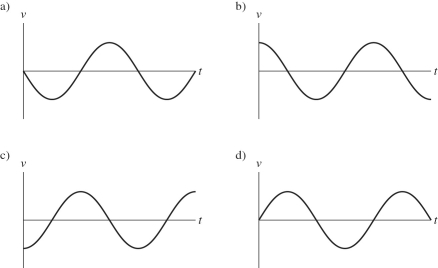
A) graph a
B) graph b
C) graph c
D) graph d
Correct Answer:

Verified
Correct Answer:
Verified
Related Questions
Q69: A 4.8-kg block attached to an ideal
Q70: In simple harmonic motion,when is the magnitude
Q71: A ball swinging at the end of
Q72: If we double the frequency of a
Q73: A simple harmonic oscillator oscillates with frequency
Q74: When a 0.350-kg package is attached to
Q76: The quartz crystal in a digital watch
Q77: An object is undergoing simple harmonic motion
Q78: An object attached to an ideal spring
Q79: In a supermarket,you place a 22.3-N (around