Multiple Choice
The figure shows a graph of the velocity v as a function of time t for a system undergoing simple harmonic motion.Which one of the following graphs represents the acceleration of this system as a function of time? 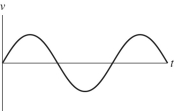
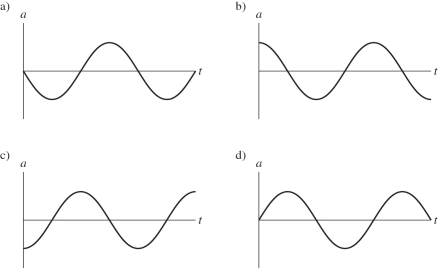
A) graph a
B) graph b
C) graph c
D) graph d
Correct Answer:

Verified
Correct Answer:
Verified
Related Questions
Q47: An object undergoing simple harmonic motion has
Q48: Grandfather clocks are designed so they can
Q49: The total mechanical energy of a simple
Q50: Two simple pendulums,A and B,are each 3.0
Q51: A 0.150-kg cart that is attached to
Q53: A ball vibrates back and forth from
Q54: A package is oscillating on a spring
Q55: An air-track cart is attached to a
Q56: An object attached to an ideal spring
Q57: A simple pendulum and a mass oscillating