Multiple Choice
The figure shows a graph of the position x as a function of time t for a system undergoing simple harmonic motion.Which one of the following graphs represents the acceleration of this system as a function of time? 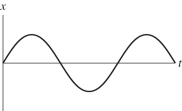
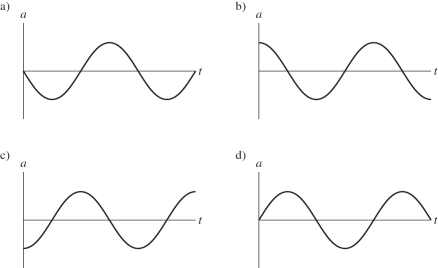
A) graph a
B) graph b
C) graph c
D) graph d
Correct Answer:

Verified
Correct Answer:
Verified
Related Questions
Q32: A pendulum that was originally erected by
Q33: If the angular frequency of the motion
Q34: A thin hoop is supported in a
Q35: An object is attached to a vertical
Q36: An object is attached to a vertical
Q38: A 51.8-kg bungee jumper jumps off a
Q39: If the amplitude of the motion of
Q40: Grandfather clocks are designed so they can
Q41: A 0.16-kg block on a horizontal frictionless
Q42: An astronaut has landed on an asteroid