Multiple Choice
Which one of the curves shown in the figure best represents the variation of wave speed v as a function of tension for transverse waves on a stretched string? 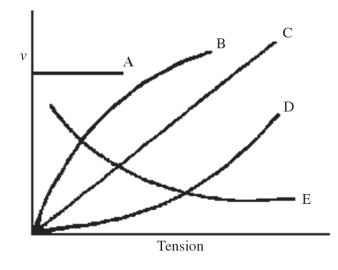
A) A
B) B
C) C
D) D
E) E
Correct Answer:

Verified
Correct Answer:
Verified
Related Questions
Q1: A car approaches you at a constant
Q2: An organ pipe open at both ends
Q3: What is the intensity level in decibels
Q4: Consider a pipe of length L that
Q5: You drop a stone down a well
Q7: Four waves are described by the following
Q8: What is the frequency of the wave
Q9: Seven seconds after a brilliant flash of
Q10: Find the speed of an ocean wave
Q11: The wavelengths of the sounds produced by