Multiple Choice
The figure shows a pV diagram for an ideal gas that is carried around a cyclic process.How much work is done in one cycle if p0 = 
And 
L? (1.00 atm = 101 kPa) 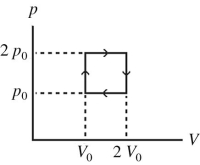
A) 1,210 J
B) 485 J
C) 2,280 J
D) 2,420 J
E) 4,850 J
Correct Answer:

Verified
Correct Answer:
Verified
Related Questions
Q43: A certain ideal gas has a molar
Q44: During an isothermal process,5.0 J of heat
Q45: A heat engine having the maximum possible
Q46: A sample of ideal monatomic gas is
Q47: A fluid in an insulated,flexible bottle is
Q49: An ideal Carnot engine operates between a
Q50: A heat pump with a performance coefficient
Q51: For an ideal gas,<br>A)C<sub>P</sub> = C<sub>V</sub> for
Q52: The figure shows a pV diagram for
Q53: The gas in a perfectly insulated but