Multiple Choice
Figure 2.3 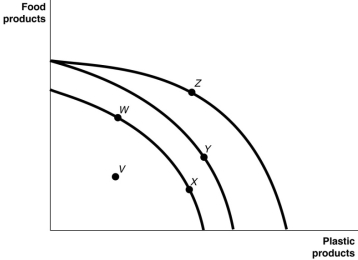 Figure 2.3 shows various points on three different production possibility frontiers for a nation.
-Refer to Figure 2.3.Consider the following movements:
a.from point V to point W
b.from point W to point Y
c.from point Y to point Z
Which of the movements listed above represents economic growth?
A) a, b, and c
B) b and c only
C) a only
D) b only
Correct Answer:

Verified
Correct Answer:
Verified
Q2: Table 2.8<br> <img src="https://d2lvgg3v3hfg70.cloudfront.net/TB3087/.jpg" alt="Table 2.8
Q12: Any output combination outside a production possibility
Q17: Scarcity<br>A)stems from the incompatibility between limited resources
Q31: For each bottle of wine that Italy
Q33: Figure 2.7 <img src="https://d2lvgg3v3hfg70.cloudfront.net/TB1015/.jpg" alt="Figure 2.7
Q38: What are the attainable production points on
Q40: Table 2.10 <img src="https://d2lvgg3v3hfg70.cloudfront.net/TB1015/.jpg" alt="Table 2.10
Q44: Adam Smith's behavioural assumption about humans was
Q164: Figure 2.6<br> <img src="https://d2lvgg3v3hfg70.cloudfront.net/TB3087/.jpg" alt="Figure 2.6
Q173: If a commercial dairy farm wants to