Multiple Choice
Figure 3.2 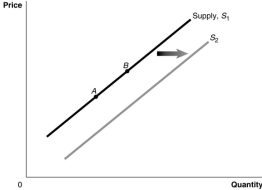
-Refer to Figure 3.2.Which movement represents increase in the number of firms in the market?
A) A to B
B) B to A
C) S1 to S2
D) S2 to S1
Correct Answer:

Verified
Correct Answer:
Verified
Q13: What results when a demand curve shifts
Q19: A change in which variable will change
Q23: Figure 3.2 <img src="https://d2lvgg3v3hfg70.cloudfront.net/TB1015/.jpg" alt="Figure 3.2
Q48: Quantity supplied refers to the amount of
Q105: If the population increases and input prices
Q114: Which of the following would cause the
Q128: Elle decreased her consumption of bananas when
Q128: Figure 3-7<br> <img src="https://d2lvgg3v3hfg70.cloudfront.net/TB4193/.jpg" alt="Figure 3-7
Q175: Which of the following would cause a
Q443: Figure 3-1 <img src="https://d2lvgg3v3hfg70.cloudfront.net/TB7397/.jpg" alt="Figure 3-1