Essay
Use the following supply schedule for cucumbers to draw a graph of the supply curve.Be sure to label the supply curve and each axis, and show each point on the supply curve. 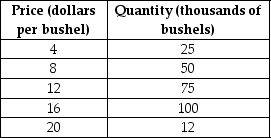
Correct Answer:

Verified
Correct Answer:
Verified
Q91: Figure 3.6 <img src="https://d2lvgg3v3hfg70.cloudfront.net/TB1015/.jpg" alt="Figure 3.6
Q92: How does the increasing use of e-books
Q94: Hamburgers and mustard are complements.If the price
Q94: Explain the differences between a change in
Q97: If the quantity supplied exceeds the quantity
Q101: An increase in the price of the
Q166: Figure 3-5<br> <img src="https://d2lvgg3v3hfg70.cloudfront.net/TB4193/.jpg" alt="Figure 3-5
Q171: Market equilibrium occurs where supply equals demand.
Q187: Figure 3-8 <img src="https://d2lvgg3v3hfg70.cloudfront.net/TB4188/.jpg" alt="Figure 3-8
Q278: Figure 3-6 <img src="https://d2lvgg3v3hfg70.cloudfront.net/TB4188/.jpg" alt="Figure 3-6