Multiple Choice
Figure 3.7 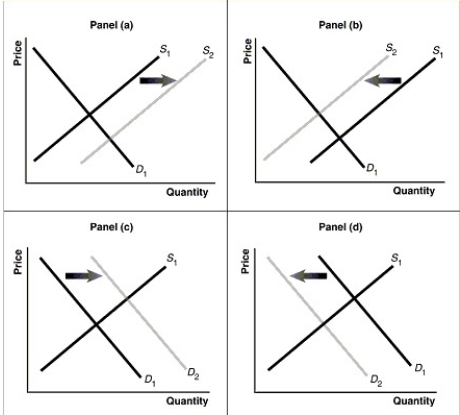
-Refer to Figure 3.7.Assume that the graphs in this figure represent the demand and supply curves for children's clothing.Which panel best describes what happens in this market when the wages of seamstresses rise?
A) Panel (a)
B) Panel (b)
C) Panel (c)
D) Panel (d)
Correct Answer:

Verified
Correct Answer:
Verified
Q3: "Because chips and salsa are complements, an
Q62: If the demand for a product increases
Q143: If the demand curve for a product
Q168: Which of the following would cause an
Q170: If bottled water is considered substitutes for
Q171: Orange juice drinkers want to consume more
Q175: Figure 3-8 <img src="https://d2lvgg3v3hfg70.cloudfront.net/TB7397/.jpg" alt="Figure 3-8
Q182: Figure 3-1 <img src="https://d2lvgg3v3hfg70.cloudfront.net/TB4188/.jpg" alt="Figure 3-1
Q239: In each of the following situations, list
Q286: Figure 3-8 <img src="https://d2lvgg3v3hfg70.cloudfront.net/TB4188/.jpg" alt="Figure 3-8