Multiple Choice
Figure 3.8 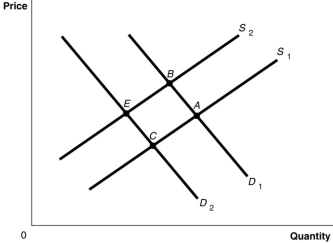
-Refer to Figure 3.8.The graph in this figure illustrates an initial competitive equilibrium in the market for apples at the intersection of D1 and S2 (point B) . Which of the following changes would cause the equilibrium to change to point C?
A) A positive change in the technology used to produce apples and a decrease in the price of oranges, a substitute for apples
B) An increase in the wages of apple workers and an increase in the price of oranges, a substitute for apples
C) An increase in the number of apple producers and a decrease in the number of apple trees as a result of disease
D) A decrease in the wages of apple workers and an increase in the price of oranges, a substitute for apples
Correct Answer:

Verified
Correct Answer:
Verified
Q7: Draw a demand curve and label it
Q10: Figure 3.8 <img src="https://d2lvgg3v3hfg70.cloudfront.net/TB1015/.jpg" alt="Figure 3.8
Q13: What results when a demand curve shifts
Q30: Indicate whether each of the following situations
Q54: Last year, the Pottery Palace supplied 8,000
Q68: If the demand for a product decreases
Q78: From a supply perspective, what impact would
Q118: Assume that both the demand curve and
Q121: Figure 3-5<br> <img src="https://d2lvgg3v3hfg70.cloudfront.net/TB4193/.jpg" alt="Figure 3-5
Q167: A decrease in the demand for incandescent