Multiple Choice
Figure 4.9 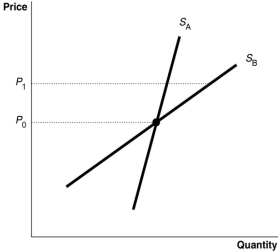
-Refer to Figure 4.9.Suppose the diagram shows the supply curves for a product in the short run and in the long run.Which supply curve represents supply in the short run and which curve represents supply in the long run?
A) SB represents supply in the short run, and SA represents supply in the long run.
B) Either SA or SB could represent supply in the short run; in the long run, the supply curve must be a vertical line.
C) Either SA or SB could represent supply in the long run; in the short run, the supply curve must be a horizontal line.
D) SA represents supply in the short run, and SB represents supply in the long run.
Correct Answer:

Verified
Correct Answer:
Verified
Q42: Suppose the demand curve for a product
Q109: The demand for heating oil in the
Q197: Figure 4.8 <img src="https://d2lvgg3v3hfg70.cloudfront.net/TB1015/.jpg" alt="Figure 4.8
Q199: If the price elasticity of demand is
Q199: Figure 4.7 <img src="https://d2lvgg3v3hfg70.cloudfront.net/TB1015/.jpg" alt="Figure 4.7
Q200: The demand for all carbonated beverages is
Q201: Figure 4.4 <img src="https://d2lvgg3v3hfg70.cloudfront.net/TB1015/.jpg" alt="Figure 4.4
Q202: If demand is perfectly inelastic, what is
Q216: If the demand for iPods is price
Q253: When demand is elastic, a fall in