Multiple Choice
Figure 5.1 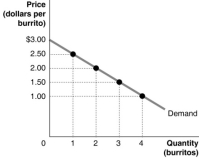 Figure 5.1 shows Arnold's demand curve for burritos.
-Refer to Figure 5.1.If the market price is $1.00, the consumer surplus on the third burrito is
A) $0.50
B) $1.00
C) $1.50
D) $7.50
Correct Answer:

Verified
Correct Answer:
Verified
Q22: The minimum wage is an example of
Q33: Economists are reluctant to state that price
Q36: Figure 5.4 <img src="https://d2lvgg3v3hfg70.cloudfront.net/TB1015/.jpg" alt="Figure 5.4
Q38: Figure 5.3 <img src="https://d2lvgg3v3hfg70.cloudfront.net/TB1015/.jpg" alt="Figure 5.3
Q40: What is the reduction in economic surplus
Q43: Table 5.3 <img src="https://d2lvgg3v3hfg70.cloudfront.net/TB1015/.jpg" alt="Table 5.3
Q44: What does a demand curve show?<br>A)The willingness
Q138: In a city with rent-controlled apartments, all
Q176: The government proposes a tax on imported
Q351: Lucinda buys a new GPS system for