Multiple Choice
Figure 5.1 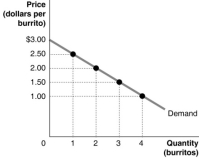 Figure 5.1 shows Arnold's demand curve for burritos.
-Refer to Figure 5.1.If the market price is $1.00, Arnold's consumer surplus is
A) $1.00
B) $2.00
C) $6.00
D) $7.00
Correct Answer:

Verified
Correct Answer:
Verified
Q44: If the quantity of fishing poles demanded
Q130: What is the difference between a price
Q142: Figure 5.5 <img src="https://d2lvgg3v3hfg70.cloudfront.net/TB1015/.jpg" alt="Figure 5.5
Q143: Figure 5.5 <img src="https://d2lvgg3v3hfg70.cloudfront.net/TB1015/.jpg" alt="Figure 5.5
Q144: Which statement is true when a competitive
Q146: Table 5.4 <img src="https://d2lvgg3v3hfg70.cloudfront.net/TB1015/.jpg" alt="Table 5.4
Q147: On what curve does each point show
Q148: Figure 5.4 <img src="https://d2lvgg3v3hfg70.cloudfront.net/TB1015/.jpg" alt="Figure 5.4
Q197: Using a supply and demand graph, illustrate
Q207: Economic surplus<br>A)does not exist when a competitive