Multiple Choice
Figure 5.4 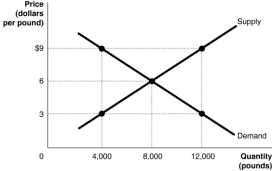
-Refer to Figure 5.4.The figure above represents the market for pecans.Assume that this is a competitive market.If the price of pecans is $9,
A) economic surplus is maximised.
B) too many consumers want to buy pecans.
C) the quantity supplied is greater than the economically efficient quantity.
D) the quantity demanded is economically efficient, but the quantity supplied is economically inefficient.
Correct Answer:

Verified
Correct Answer:
Verified
Q4: In a competitive market, the demand curve
Q44: If the quantity of fishing poles demanded
Q61: What is marginal benefit? Which curve is
Q130: What is the difference between a price
Q147: On what curve does each point show
Q148: Figure 5.4 <img src="https://d2lvgg3v3hfg70.cloudfront.net/TB1015/.jpg" alt="Figure 5.4
Q151: Figure 5.4 <img src="https://d2lvgg3v3hfg70.cloudfront.net/TB1015/.jpg" alt="Figure 5.4
Q153: Table 5.4 <img src="https://d2lvgg3v3hfg70.cloudfront.net/TB1015/.jpg" alt="Table 5.4
Q155: Figure 5.8 <img src="https://d2lvgg3v3hfg70.cloudfront.net/TB1015/.jpg" alt="Figure 5.8
Q157: Figure 5.7 <img src="https://d2lvgg3v3hfg70.cloudfront.net/TB1015/.jpg" alt="Figure 5.7