Multiple Choice
Table 6.2 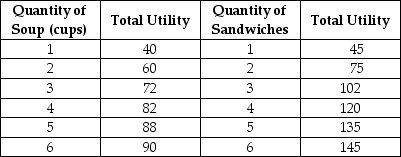 Table 6.2 above shows Keira's utility from soup and sandwiches.The price of soup is $2 per cup and the price of a sandwich is $3.Keira has $18 to spend on these two goods.
-Refer to Table 6.2.Holding prices constant, when Keira's income changed from $18 to $23, what happens to her total utility and to the marginal utilities of the last cup of soup and the last sandwich purchased?
A) Her total utility increases, but the marginal utilities of the last cup of soup and the last sandwich consumed decrease.
B) Her total utility, the marginal utility of the last cup of soup consumed and the marginal utility of the last sandwich consumed all increase.
C) Her total utility decreases, but the marginal utilities of the last cup of soup and the last sandwich consumed increase.
D) Her total utility and the marginal utility of the last cup of soup consumed increase, but marginal utility of the last sandwich consumed decreases.
Correct Answer:

Verified
Correct Answer:
Verified
Q13: Consider the following hypothetical scenarios: Scenario A:
Q14: What is one reason that consumers and
Q16: Table 6.5 <img src="https://d2lvgg3v3hfg70.cloudfront.net/TB1015/.jpg" alt="Table 6.5
Q18: Table 6.2 <img src="https://d2lvgg3v3hfg70.cloudfront.net/TB1015/.jpg" alt="Table 6.2
Q19: One reason university students do not study
Q21: If you exhibit the endowment effect as
Q22: Figure 6.3 <img src="https://d2lvgg3v3hfg70.cloudfront.net/TB1015/.jpg" alt="Figure 6.3
Q87: All consumption bundles along a given indifference
Q221: The demand curve for canned peas is
Q279: Economists have used the ultimatum game and