Multiple Choice
Figure 6.2 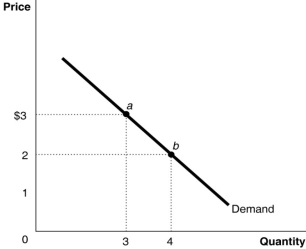 Figure 6.2 represents the demand for ice cream cones.
-Refer to Figure 6.2.When the price of ice cream cones increases from $2 to $3, quantity demanded decreases from 4 ice cream cones to 3 ice cream cones.This change in quantity demanded is due to
A) the price and output effects.
B) the income and substitution effects.
C) the law of diminishing marginal utility.
D) the fact that marginal willingness to pay falls.
Correct Answer:

Verified
Correct Answer:
Verified
Q4: Economists assume people's tastes are identical.
Q46: The substitution effect of a decrease in
Q61: If Valerie purchases ankle socks at $5
Q62: Behavioural economics helps explain why customers _
Q65: Behavioural economists examine choices that consumers make
Q66: Figure 6.7 <img src="https://d2lvgg3v3hfg70.cloudfront.net/TB1015/.jpg" alt="Figure 6.7
Q67: Which of the following is true about
Q97: Wilbur Rickhiser, a financial advisor, recently told
Q144: Consider a downward-sloping demand curve.When the price
Q251: One possible reason as to why consumers