Essay
Fill in the missing values in the following table.Draw one graph showing how total output increases with the quantity of workers hired, and another graph showing the marginal product of labour and the average product of labour. 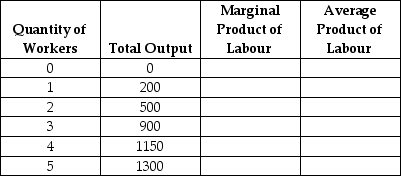
Correct Answer:

Verified
Correct Answer:
Verified
Q1: Describe the difference between technology and positive
Q85: Average variable cost can be calculated using
Q193: If we have information about workers' marginal
Q222: The statement that correctly describes the distinction
Q223: Figure 7.5 <img src="https://d2lvgg3v3hfg70.cloudfront.net/TB1015/.jpg" alt="Figure 7.5
Q224: After Suzie, owner of Suzie's Sweet Shop,
Q225: Consider a firm that uses two inputs,
Q226: Table 7.7 <img src="https://d2lvgg3v3hfg70.cloudfront.net/TB1015/.jpg" alt="Table 7.7
Q232: Over the past twenty years, the number
Q322: As output increases,<br>A)average variable cost becomes smaller