Essay
Figure 7.8 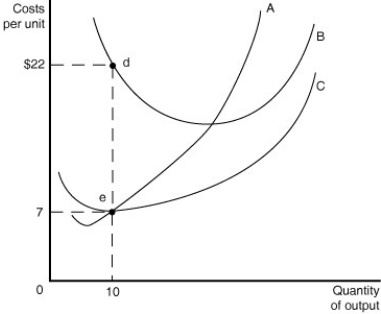
-Refer to Figure 7.8 above to answer the following questions.
a.Identify the curves in the diagram.
A ________
B ________
C ________
b.What is the numerical value of fixed cost when the quantity of output = 10?
c.What is the numerical value of variable cost when the quantity of output = 10?
d.What is the numerical value of total cost when the quantity of output = 10?
e.What is the numerical value of average fixed cost when the quantity of output = 10?
f.What is the numerical value of average total cost when the quantity of output = 10?
g.On the graph identify the area that represents the total variable cost of production when the quantity of output = 10.
h.On the graph identify the area that represents the fixed cost of production when the quantity of output = 10.
__________________________________________________________________________________________________________________________________________________________________________________________
Correct Answer:

Verified
a.A=Marginal cost curve; B = A...View Answer
Unlock this answer now
Get Access to more Verified Answers free of charge
Correct Answer:
Verified
View Answer
Unlock this answer now
Get Access to more Verified Answers free of charge
Q46: In the long run which of the
Q61: Which of the following is a reason
Q175: In economics, what is the difference between
Q288: If 11 workers can produce 53 units
Q289: Table 7.9 <img src="https://d2lvgg3v3hfg70.cloudfront.net/TB1015/.jpg" alt="Table 7.9
Q293: Which of the following does not determine
Q294: Figure 7.13 <img src="https://d2lvgg3v3hfg70.cloudfront.net/TB1015/.jpg" alt="Figure 7.13
Q295: If the total cost of producing 20
Q297: Figure 7.15 <img src="https://d2lvgg3v3hfg70.cloudfront.net/TB1015/.jpg" alt="Figure 7.15
Q325: Red Stone Creamery currently hires 5 workers.When