Multiple Choice
Figure 7.12 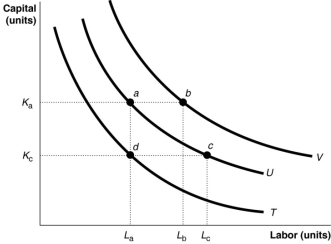
-Refer to Figure 7.12.The movement from isoquant T to isoquant U depicts
A) a change in preferences with regards to input usage.
B) an increase in the cost of production.
C) an increase in output.
D) an increase in labour usage holding capital and output constant.
Correct Answer:

Verified
Correct Answer:
Verified
Q76: If, when a firm doubles all its
Q81: If a firm's long-run average total curve
Q92: Maria's Yiros House sells yiros.The cost of
Q94: Use the following graph to answer the
Q95: Figure 7.10 <img src="https://d2lvgg3v3hfg70.cloudfront.net/TB1015/.jpg" alt="Figure 7.10
Q99: How is the marginal product of labour
Q100: Consider a manufacturing operation that uses specialised
Q101: The division of labour and specialisation explain<br>A)why,
Q149: If production displays diseconomies of scale, the
Q280: A U-shaped long-run average cost curve implies