Multiple Choice
Figure 8.12 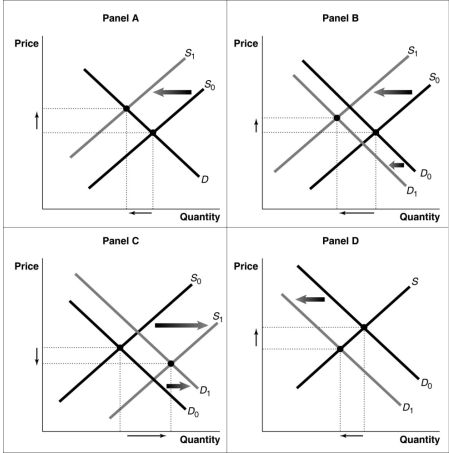
-Refer to Figure 8.12.Consider a typical firm in a perfectly competitive industry which is incurring short-run losses.Which of the diagrams in the figure shows the effect on the industry as it transitions to a long-run equilibrium?
A) Panel A
B) Panel B
C) Panel C
D) Panel D
Correct Answer:

Verified
Correct Answer:
Verified
Q56: Which of the following offers the best
Q57: Figure 8.14 <img src="https://d2lvgg3v3hfg70.cloudfront.net/TB1015/.jpg" alt="Figure 8.14
Q58: Table 8.4 <img src="https://d2lvgg3v3hfg70.cloudfront.net/TB1015/.jpg" alt="Table 8.4
Q63: Figure 8.1 <img src="https://d2lvgg3v3hfg70.cloudfront.net/TB1015/.jpg" alt="Figure 8.1
Q64: Table 8.1 <img src="https://d2lvgg3v3hfg70.cloudfront.net/TB1015/.jpg" alt="Table 8.1
Q83: If a firm's total variable cost exceeds
Q88: Market supply is found by<br>A)vertically summing the
Q124: A perfectly competitive firm's marginal revenue curve
Q188: In the long run, perfectly competitive firms
Q217: When firms exit a perfectly competitive industry,