Multiple Choice
Figure 9.3 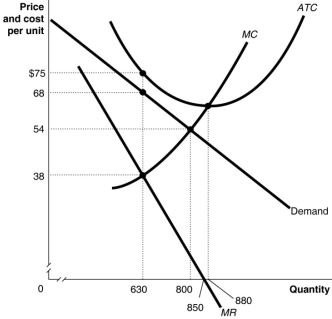 Figure 9.3 above shows the demand and cost curves facing a monopolist.
-Refer to Figure 9.3.Suppose the monopolist represented in the diagram above produces positive output.The profit-maximising/loss-minimising output level is
A) 630 units
B) 800 units
C) 850 units
D) 880 units
Correct Answer:

Verified
Correct Answer:
Verified
Q8: Figure 9.7 <img src="https://d2lvgg3v3hfg70.cloudfront.net/TB1015/.jpg" alt="Figure 9.7
Q9: One reason patent protection is vitally important
Q15: Table 9.2 <img src="https://d2lvgg3v3hfg70.cloudfront.net/TB1015/.jpg" alt="Table 9.2
Q17: Many universities practice yield management.As a result,
Q18: What does a monopolist face, compared to
Q86: A public franchise gives the exclusive right
Q97: Holding everything else constant, government approval of
Q187: A monopoly is a firm that is
Q197: Compared to perfect competition, the consumer surplus
Q245: Assume a hypothetical case where an industry