Multiple Choice
Figure 9.4 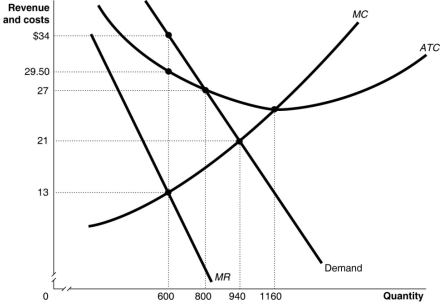 Figure 9.4 shows the demand and cost curves for a monopolist.
-Refer to Figure 9.4.The amount of the monopoly's total revenue us
A) $21 600
B) $20 400
C) $19 740
D) $7800
Correct Answer:

Verified
Correct Answer:
Verified
Q30: Economic efficiency requires that a natural monopoly's
Q43: Which of the following is necessary in
Q101: Yield management and price discrimination have enabled
Q149: Which one of the following is not
Q152: Price discrimination is possible in which of
Q226: In which market structure is it not
Q227: Why do firms price discriminate?<br>A)To reduce the
Q229: Table 9.3 <img src="https://d2lvgg3v3hfg70.cloudfront.net/TB1015/.jpg" alt="Table 9.3
Q230: Figure 9.10 <img src="https://d2lvgg3v3hfg70.cloudfront.net/TB1015/.jpg" alt="Figure 9.10
Q235: If a monopolist's marginal revenue is $25