Multiple Choice
Figure 9.4 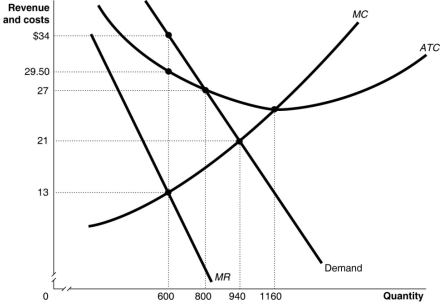 Figure 9.4 shows the demand and cost curves for a monopolist.
-Refer to Figure 9.4.The monopoly's total cost of production is
A) $21 600
B) $17 700
C) $9340
D) $7800
Correct Answer:

Verified
Correct Answer:
Verified
Q51: A local electricity-generating company has a monopoly
Q73: Price discrimination is the practice of<br>A)charging different
Q85: What is another term for perfect price
Q87: Figure 9.16 <img src="https://d2lvgg3v3hfg70.cloudfront.net/TB1015/.jpg" alt="Figure 9.16
Q89: What does a monopoly face?<br>A)A perfectly elastic
Q91: Table 9.1 <img src="https://d2lvgg3v3hfg70.cloudfront.net/TB1015/.jpg" alt="Table 9.1
Q92: Figure 9.4 <img src="https://d2lvgg3v3hfg70.cloudfront.net/TB1015/.jpg" alt="Figure 9.4
Q93: Figure 9.4 <img src="https://d2lvgg3v3hfg70.cloudfront.net/TB1015/.jpg" alt="Figure 9.4
Q95: Which of the following is a reason
Q95: Figure 9.2 <img src="https://d2lvgg3v3hfg70.cloudfront.net/TB1015/.jpg" alt="Figure 9.2