Multiple Choice
Figure 9.6 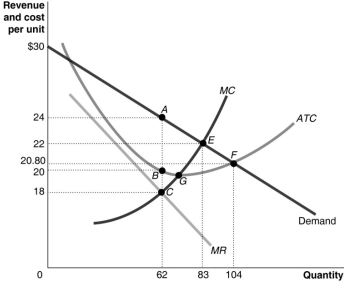 Figure 9.6 shows the cost and demand curves for a monopolist.
-Refer to Figure 9.6.What is the monopolist's total cost?
A) $1116.
B) $1240.
C) $1660.
D) $1726.40.
Correct Answer:

Verified
Correct Answer:
Verified
Q31: Table 9.3 <img src="https://d2lvgg3v3hfg70.cloudfront.net/TB1015/.jpg" alt="Table 9.3
Q33: A profit-maximising monopoly's price is<br>A)the same as
Q34: Assume a hypothetical case where an industry
Q36: Which of the following is not a
Q37: Figure 9.11 <img src="https://d2lvgg3v3hfg70.cloudfront.net/TB1015/.jpg" alt="Figure 9.11
Q38: What must a firm have to maintain
Q103: Which one of the following about a
Q140: What is the relationship between marginal revenue
Q141: A monopolist's demand curve is the same
Q164: Equilibrium in a perfectly competitive market results