Multiple Choice
Figure 9.6 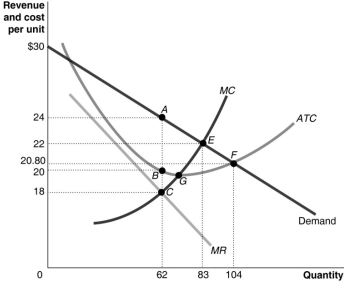 Figure 9.6 shows the cost and demand curves for a monopolist.
-Refer to Figure 9.6.What amount of profit does the monopolist earn?
A) $0.
B) $170.
C) $248.
D) $372.
Correct Answer:

Verified
Correct Answer:
Verified
Q3: If price discrimination occurs in a market,<br>A)the
Q5: What three conditions must hold for a
Q61: Joss is a marketing consultant. Iris and
Q150: A market economy benefits from market power<br>A)if
Q162: The market demand curve facing a monopolist
Q250: Because each customer pays according to her
Q252: Online companies gather personal information about the
Q254: Table 9.3 <img src="https://d2lvgg3v3hfg70.cloudfront.net/TB1015/.jpg" alt="Table 9.3
Q259: Table 9.3 <img src="https://d2lvgg3v3hfg70.cloudfront.net/TB1015/.jpg" alt="Table 9.3
Q260: Figure 9.4 <img src="https://d2lvgg3v3hfg70.cloudfront.net/TB1015/.jpg" alt="Figure 9.4