Multiple Choice
Figure 9.9 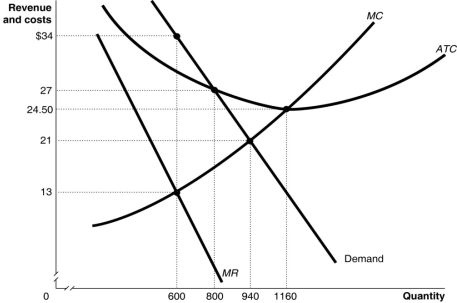 Figure 9.9 shows the demand and cost curves for a monopolist.
-Refer to Figure 9.9.The economically efficient output level is
A) 600 units
B) 800 units
C) 940 units
D) 1160 units
Correct Answer:

Verified
Correct Answer:
Verified
Q58: If Mort's House of Flowers sells one
Q61: a.What is the difference between a horizontal
Q104: Ordinarily, governments attempt to promote competition in
Q105: How does a monopoly differ from monopolistic
Q106: Figure 9.10 <img src="https://d2lvgg3v3hfg70.cloudfront.net/TB1015/.jpg" alt="Figure 9.10
Q107: Joss is a marketing consultant.Iris and Daphne
Q111: Which of the following undermines a firm's
Q209: Relative to a perfectly competitive market, a
Q218: Because a monopoly's demand curve is the
Q230: Joss is a marketing consultant. Iris and