Multiple Choice
Figure 9.9 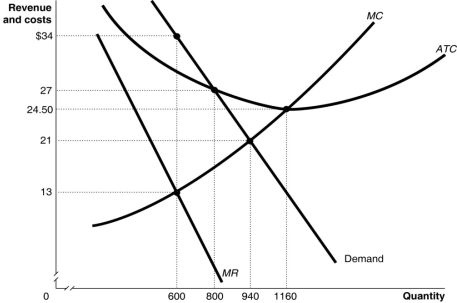 Figure 9.9 shows the demand and cost curves for a monopolist.
-Refer to Figure 9.9.The difference between the monopoly output and the perfectly competitive output is
A) 140 units
B) 240 units
C) 340 units
D) 560 units
Correct Answer:

Verified
Correct Answer:
Verified
Q90: A vertical merger is one that takes
Q117: Figure 9.6 <img src="https://d2lvgg3v3hfg70.cloudfront.net/TB1015/.jpg" alt="Figure 9.6
Q118: Suppose a monopoly is producing its profit-maximising
Q120: If a monopolist engages in first-degree price
Q121: With perfect price discrimination, which of the
Q123: Figure 9.3 <img src="https://d2lvgg3v3hfg70.cloudfront.net/TB1015/.jpg" alt="Figure 9.3
Q126: There are several types of barriers to
Q143: If a per-unit tax on output sold
Q164: Which of the following is not a
Q246: A patent<br>A) grants the creator of a