Multiple Choice
Figure 9.9 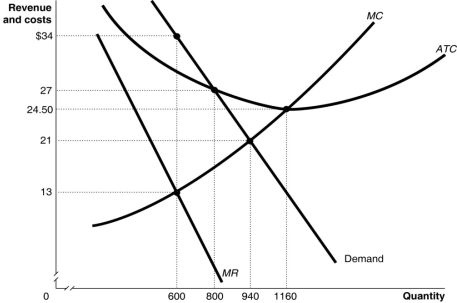 Figure 9.9 shows the demand and cost curves for a monopolist.
-Refer to Figure 9.9.At the profit-maximising quantity, the difference between the monopoly's price and the marginal cost of production is
A) $8
B) $11.50
C) $21
D) There is no difference.
Correct Answer:

Verified
Correct Answer:
Verified
Related Questions
Q62: With perfect price discrimination there is<br>A)no deadweight
Q78: If a firm's average total cost is
Q106: A patent or copyright is a barrier
Q183: Price discrimination is a rational strategy for
Q184: If a monopolist's price is $50 per
Q187: If a monopolist's marginal revenue is $35
Q192: Explain whether a monopoly that maximises profit
Q226: Why is it necessary for a firm
Q239: In regulating a natural monopoly, the price
Q278: If the market for a product begins