Multiple Choice
Figure 10.4 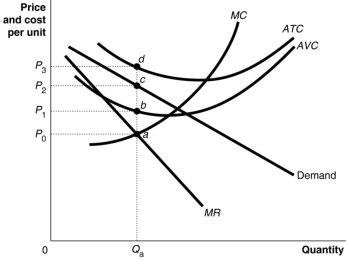 Figure 10.4 shows short-run cost and demand curves for a monopolistically competitive firm in the market for designer watches.
-Refer to Figure 10.4.The area that represents the total fixed cost of production is
A) 0P1aQa
B) P0adP3
C) P1bdP3
D) That information cannot be determined from the graph.
Correct Answer:

Verified
Correct Answer:
Verified
Q9: If firms in a monopolistically competitive market
Q52: In theory, in the long run, monopolistically
Q53: Table 10.2 <img src="https://d2lvgg3v3hfg70.cloudfront.net/TB1015/.jpg" alt="Table 10.2
Q54: Figure 10.4 <img src="https://d2lvgg3v3hfg70.cloudfront.net/TB1015/.jpg" alt="Figure 10.4
Q55: Assume that price exceeds average variable cost
Q59: Complete the following table. <img src="https://d2lvgg3v3hfg70.cloudfront.net/TB1015/.jpg" alt="Complete
Q68: Economists agree that a monopolistically competitive market
Q135: Which of the following is not a
Q261: A monopolistically competitive firm that earns an
Q268: In the long-run equilibrium, both the perfectly