Multiple Choice
Figure 10.9 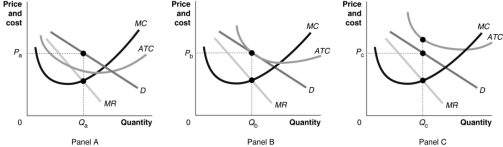
-Refer to Figure 10.9.The graph in the figure that depicts a monopolistically competitive firm that is minimising its losses is
A) Panel A
B) Panel B
C) Panel C
D) Panel A and Panel C
Correct Answer:

Verified
Correct Answer:
Verified
Q66: Which of the following is not a
Q98: Table 10.4 <img src="https://d2lvgg3v3hfg70.cloudfront.net/TB1015/.jpg" alt="Table 10.4
Q99: What must be true for allocative efficiency
Q99: If some monopolistically competitive firms exit their
Q100: In contrast with perfect competition, excess capacity
Q104: Figure 10.14 <img src="https://d2lvgg3v3hfg70.cloudfront.net/TB1015/.jpg" alt="Figure 10.14
Q106: What do the entry and exit of
Q172: Discuss the role of product differentiation and
Q237: Monopolistically competitive firms can differentiate their products<br>A)by
Q257: Economists believe that consumers would be better