Multiple Choice
Figure 12.3 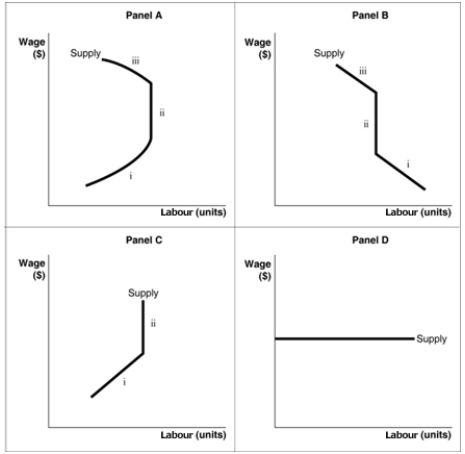
-Refer to Figure 12.3.The panel in the diagram which best represents an individual's labour supply curve is?
A) Panel A
B) Panel B
C) Panel C
D) Panel D
Correct Answer:

Verified
Correct Answer:
Verified
Q98: Suppose you have worked at a local
Q99: How will a government-imposed minimum wage affect
Q100: A firm should hire more workers to
Q101: An increase in the supply of capital,
Q103: Table 12.4 <img src="https://d2lvgg3v3hfg70.cloudfront.net/TB1015/.jpg" alt="Table 12.4
Q105: Figure 12.3 <img src="https://d2lvgg3v3hfg70.cloudfront.net/TB1015/.jpg" alt="Figure 12.3
Q106: Figure 12.3 <img src="https://d2lvgg3v3hfg70.cloudfront.net/TB1015/.jpg" alt="Figure 12.3
Q107: To what will an increase in the
Q124: If it is difficult for a firm
Q179: If you were to ask your employer