Multiple Choice
Figure 15.2 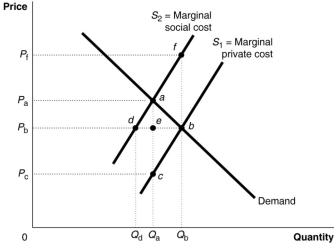 Figure 15.2 shows a market with a negative externality.
-Refer to Figure 15.2.The size of marginal external costs can be determined by
A) S2 + S1 at each output level.
B) S2 - S1 at each output level.
C) the supply curve S2.
D) the supply curve S1.
Correct Answer:

Verified
Correct Answer:
Verified
Q3: Which of the following displays these two
Q28: Figure 15.3 <img src="https://d2lvgg3v3hfg70.cloudfront.net/TB1015/.jpg" alt="Figure 15.3
Q30: Figure 15.3 <img src="https://d2lvgg3v3hfg70.cloudfront.net/TB1015/.jpg" alt="Figure 15.3
Q32: Figure 15.6 <img src="https://d2lvgg3v3hfg70.cloudfront.net/TB1015/.jpg" alt="Figure 15.6
Q34: The marginal social benefit curve is a
Q36: Figure 15.13 <img src="https://d2lvgg3v3hfg70.cloudfront.net/TB1015/.jpg" alt="Figure 15.13
Q37: Which of the following is not a
Q78: Which of the following must be present
Q135: Classifying a good as rival means<br>A)that the
Q232: If there is pollution in producing a