Multiple Choice
Figure 15.6 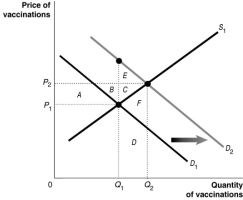 Figure 15.6 shows the market for measles vaccinations, a product whose use generates positive externalities.
-Refer to Figure 15.6.What does D1 represent?
A) The demand curve reflecting social benefit
B) The positive externalities curve
C) The demand curve reflecting private benefit
D) The social welfare curve
Correct Answer:

Verified
Correct Answer:
Verified
Q2: Why will for-profit producers not produce public
Q4: Figure 15.5 <img src="https://d2lvgg3v3hfg70.cloudfront.net/TB1015/.jpg" alt="Figure 15.5
Q7: Figure 15.4 <img src="https://d2lvgg3v3hfg70.cloudfront.net/TB1015/.jpg" alt="Figure 15.4
Q9: If the social cost of producing a
Q10: Assume that production from an electric utility
Q11: Figure 15.6 <img src="https://d2lvgg3v3hfg70.cloudfront.net/TB1015/.jpg" alt="Figure 15.6
Q65: Which of the following describes how a
Q98: Suppose a tax equal to the value
Q128: A market failure arises when an entire
Q227: An externality is an example of a