Multiple Choice
Figure 15.14 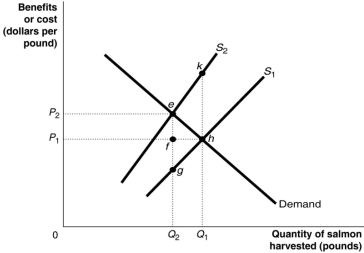 Figure 15.14 shows the market for Atlantic tuna, a common resource.The current market equilibrium output of Q1 is not the economically efficient output.The economically efficient output is Q2.
-Refer to Figure 15.14.The current market equilibrium output is partly the result of overfishing.In that case, what does S1 represent?
A) The private marginal cost of harvesting tuna
B) The social marginal cost of harvesting tuna
C) The private marginal benefit of harvesting tuna
D) The social marginal benefit of harvesting tuna
Correct Answer:

Verified
Correct Answer:
Verified
Q9: If the social cost of producing a
Q10: Assume that production from an electric utility
Q11: Figure 15.6 <img src="https://d2lvgg3v3hfg70.cloudfront.net/TB1015/.jpg" alt="Figure 15.6
Q12: What does the phrase 'internalising an external
Q14: When the government imposes a tax equal
Q15: Which of the following is an example
Q18: One difference between the demand for a
Q106: Medical research that ends in a cure
Q116: When there is a negative externality, the
Q227: An externality is an example of a