Essay
Figure 16.3 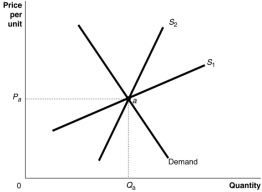
-Refer to Figure 16.3.The figure above shows a demand curve and two supply curves, one more elastic than the other.Use Figure 16-3 to answer the following questions.
a.Suppose the government imposes an excise tax of $1.00 on every unit sold.Use the graph to illustrate the impact of this tax.
b.If the government imposes an excise tax of $1.00 on every unit sold, will the consumer pay more of the tax if the supply curve is S1 or S2? Refer to the graphs in your answer.
c.If an excise tax of $1.00 on every unit sold is imposed, will the revenue collected by the government be greater if the supply curve is S1 or S2?
d.If the government imposes an excise tax of $1.00 on every unit sold, will the deadweight loss be greater if the supply curve is S1 or S2?
Correct Answer:

Verified
a.The supply curve shifts up by the full...View Answer
Unlock this answer now
Get Access to more Verified Answers free of charge
Correct Answer:
Verified
View Answer
Unlock this answer now
Get Access to more Verified Answers free of charge
Q18: Figure 16.2 <img src="https://d2lvgg3v3hfg70.cloudfront.net/TB1015/.jpg" alt="Figure 16.2
Q23: Figure 16.7 <img src="https://d2lvgg3v3hfg70.cloudfront.net/TB1015/.jpg" alt="Figure 16.7
Q24: Figure 16.4 <img src="https://d2lvgg3v3hfg70.cloudfront.net/TB1015/.jpg" alt="Figure 16.4
Q25: Figure 16.1 <img src="https://d2lvgg3v3hfg70.cloudfront.net/TB1015/.jpg" alt="Figure 16.1
Q27: What happens when the demand for a
Q28: The "ability-to-pay" principle of taxation is the
Q113: The corporate income tax is ultimately paid
Q133: What is meant by "tax incidence"?
Q156: The idea that two taxpayers in the
Q212: If grocery stores were legally required to