Multiple Choice
Rank the supply curves in the figure below in order of greatest to least price elasticity at the common intersection point. 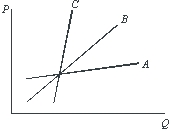
A) C, A, B.
B) B, A, C.
C) B, C, A.
D) A, B, C.
E) None of the above.
Correct Answer:

Verified
Correct Answer:
Verified
Related Questions
Q58: If a good is in fixed supply,
Q59: Consider some price range in which a
Q60: With all of the new technology available,
Q61: During the first year that the Salk
Q62: Use the following to answer questions :<br>Figure
Q64: The price elasticity of demand is the:<br>A)change
Q65: If demand is relatively price inelastic:<br>A)a 1
Q66: Given the supply and demand curves shown
Q67: A vertical supply curve may be described
Q68: The government levies an excise tax of