Multiple Choice
Use the following to answer questions :
Figure 4-1 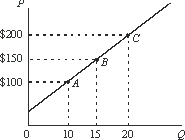
-The price elasticity of supply shown in Figure 4-1 between points A and B is:
A) .1.
B) .5.
C) 1.
D) 5.
E) none of the above.
Correct Answer:

Verified
Correct Answer:
Verified
Related Questions
Q45: When demand displays unitary price elasticity at
Q46: A bumper harvest automatically means that farmers
Q47: How do companies use price elasticity to
Q48: Use the following to answer questions :<br>Figure
Q49: An increase in population will increase the
Q51: Sales of the common necessities of life
Q52: If a demand curve displays unitary elasticity,
Q53: An increase in the minimum wage will
Q54: Use the following to answer questions :<br>Figure
Q55: Use the following to answer questions :<br>Figure