Multiple Choice
Use the following to answer questions :
Figure 3-1 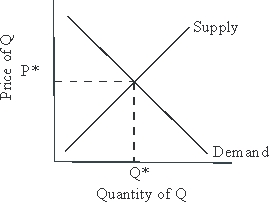
-Given the supply and demand curves drawn for a normal good in Figure 3-1, an increase in income can be expected to cause:
A) equilibrium price and quantity to increase.
B) equilibrium price to increase and equilibrium quantity to fall.
C) equilibrium price to increase while equilibrium quantity holds steady.
D) equilibrium price and quantity to fall.
E) equilibrium price to fall and equilibrium quantity to climb.
Correct Answer:

Verified
Correct Answer:
Verified
Q71: The demand curve for a normal good
Q72: Market equilibrium comes at the price which
Q73: A change in tastes can cause people
Q74: Use the following to answer questions :<br>Figure
Q75: Which of the following does not explain
Q77: If the demand schedule may be written
Q78: The quantity of labor demanded by an
Q79: A fixed supply of apartments can be
Q80: When we say that a price in
Q81: Use the following to answer questions :<br>Figure