Multiple Choice
Exhibit 21-6 The graph below illustrates various cost behavior patterns in XYZ Company.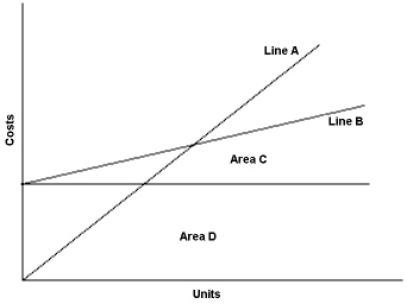
-Refer to Exhibit 21-6. In the graph above, total costs are represented by:
A) Line A
B) Line B
C) Area C
D) Area D
Correct Answer:

Verified
Correct Answer:
Verified
Related Questions
Q87: The scattergraph method is a useful tool
Q88: If a company has a positive contribution
Q89: If a company's total fixed costs decreased
Q90: If sales revenue is equal for a
Q91: Which of the following costs would LEAST
Q93: Contribution margin is equal to:<br>A) Revenues -
Q94: The following information has been compiled by
Q95: Total contribution margin will increase in a
Q96: Beta Corp. has a 45% contribution margin
Q97: A firm's per-unit contribution margin is $30,